Featured Infographics


Latest Infographics
Infographic
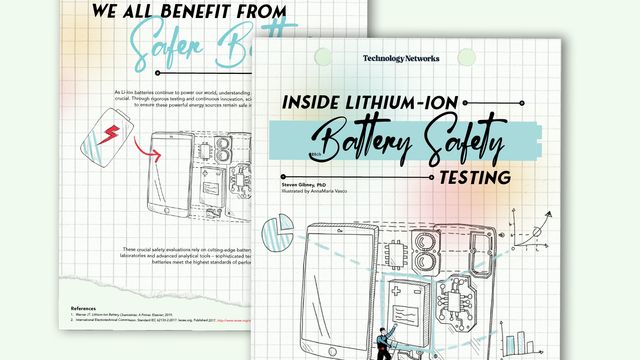
Inside Lithium-Ion Safety Testing
This infographic explores the inner workings of lithium-ion batteries and the testing protocols that ensure these powerful energy sources remain safe for everyday use.

Infographic
Explore the Evolution of Pesticide Analysis
This infographic guides you through the analytical journey from early detection limitations to cutting-edge screening technology, providing the insights needed to meet modern food safety and regulatory compliance demands.
Infographic
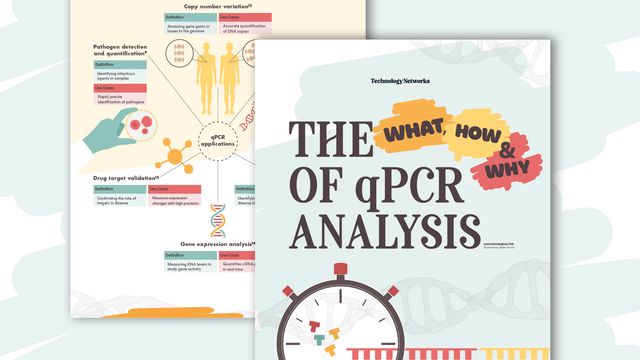
The What, How and Why of qPCR Analysis
This infographic highlights the principles, strengths and limitations of qPCR while showcasing its applications across fields including oncology, pathogen detection, gene expression, biomarker discovery and beyond.
Infographic
Oligonucleotide Purification Strategies To Enhance Performance and Versatility
This infographic highlights the high-performance purification techniques that are essential for high-quality oligo production.
Infographic
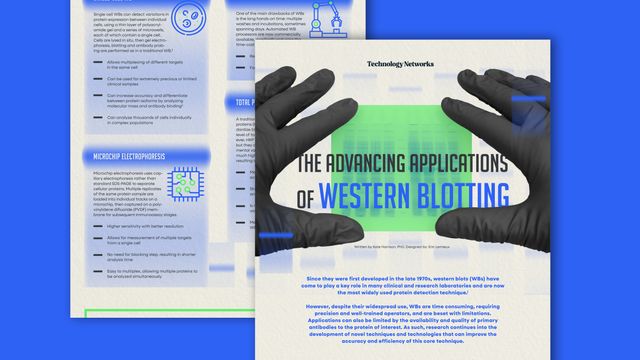
The Advancing Applications of Western Blotting
This infographic provides a comprehensive look at the evolving landscape of western blotting. It outlines diverse application areas and explores technological advances that are overcoming long-standing limitations.
Infographic
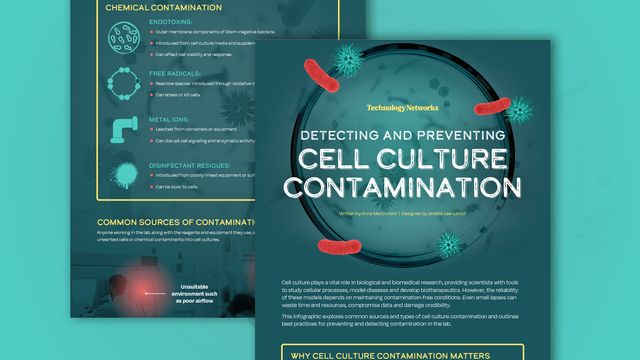
Detecting and Preventing Cell Culture Contamination
This infographic explores common sources and types of cell culture contamination and outlines best practices for preventing and detecting contamination in the lab.
Infographic
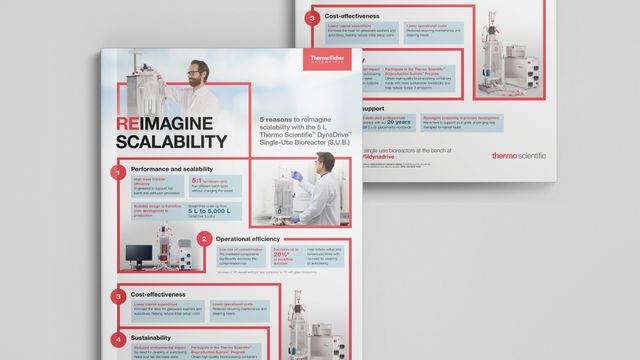
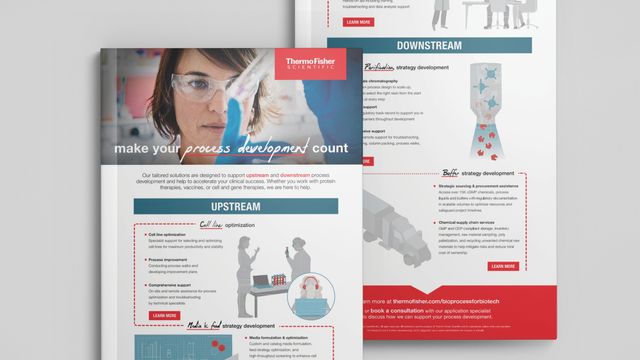
Rethink Scalability in Bioprocess Development
This infographic highlights how bench-scale single-use bioreactors help overcome these barriers with efficiency, flexibility and reduced environmental impact.
Infographic
Key Insights Shaping Biotech Today
This infographic highlights critical biotech trends and offers a snapshot of opportunities shaping the future of biologics and beyond.
Infographic
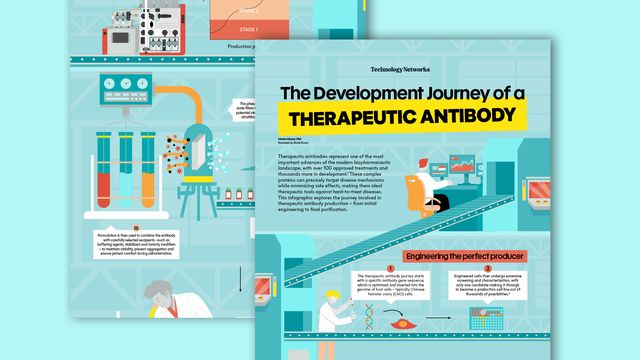
Explore the Journey of Therapeutic Antibody Production
This infographic takes you inside the intricate world of therapeutic antibody production, revealing the sophisticated science and meticulous quality controls that transform a single engineered cell into millions of doses of medicine.
Advertisement