Featured Infographics


Latest Infographics
Infographic
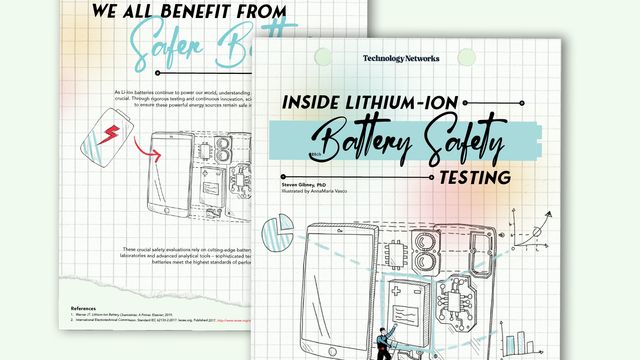
Inside Lithium-Ion Safety Testing
This infographic explores the inner workings of lithium-ion batteries and the testing protocols that ensure these powerful energy sources remain safe for everyday use.

Infographic
Explore the Evolution of Pesticide Analysis
This infographic guides you through the analytical journey from early detection limitations to cutting-edge screening technology, providing the insights needed to meet modern food safety and regulatory compliance demands.
Infographic
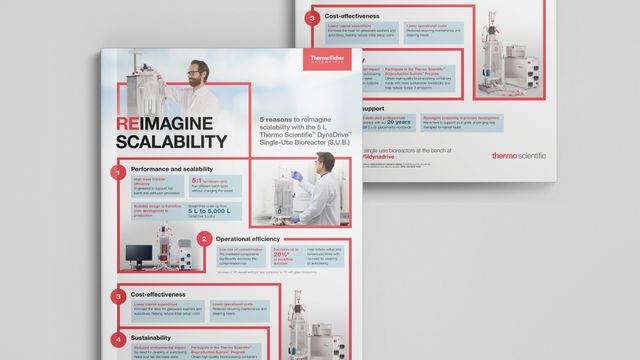
Rethink Scalability in Bioprocess Development
This infographic highlights how bench-scale single-use bioreactors help overcome these barriers with efficiency, flexibility and reduced environmental impact.
Infographic
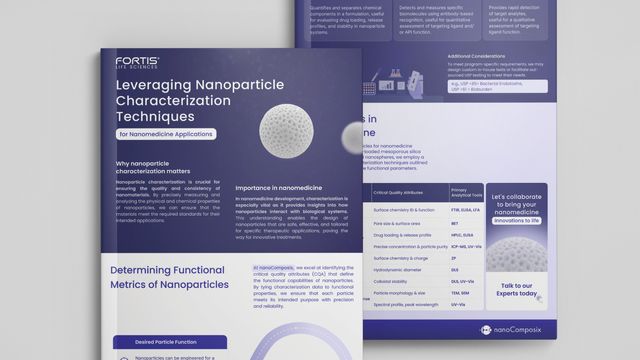
Optimize Nanomedicine With Better Particle Insight
This infographic explores the most effective techniques for analyzing nanoparticle properties, offering guidance on selecting the right tools for measuring critical quality attributes and improving design precision.
Infographic
How Modern Technology Can Help Mitigate Risk and Failure in the Pharma QC Lab Infographic
This infographic describes on modern technology can drastically improve quality management in the laboratory by minimizing downtime and associated costs, improving productivity and security, and reducing compliance issues.

Infographic
Alliance iS HPLC System Infographic
This infographic describes the features and functionality of the Alliance iS HPLC System that will help your lab run more efficiently.

Infographic
LC Method Adjustment Made Simple: A Practical Guide
This infographic describes a step-by-step approach to adjusting your methods that can help you achieve your goals and save time in the process.

Infographic
Meet the Alliance iS HPLC Family
This infographic explores the system and integrated detector options in the Alliance iS HPLC System and Alliance iS Bio HPLC System that enable your lab to meet its everyday challenges.
Infographic
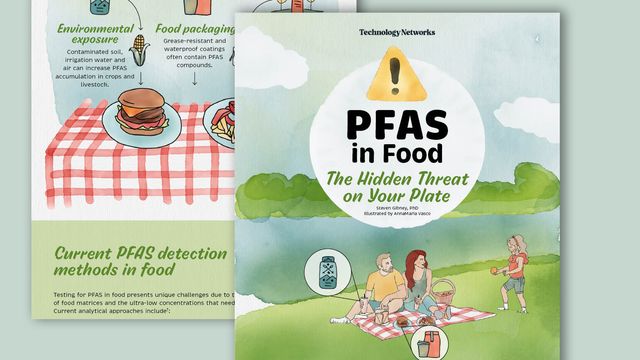
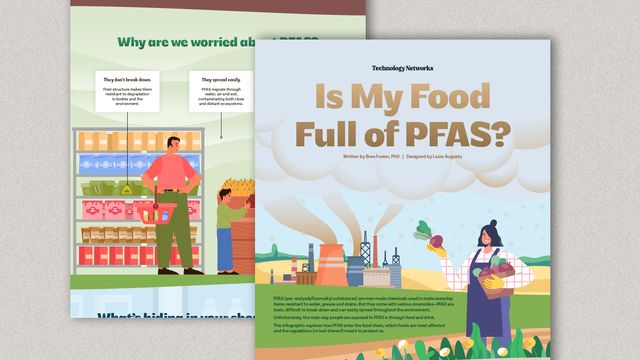
Is My Food Full of PFAS?
This infographic highlights how PFAS enter the food chain, identifies the foods most affected and outlines the gaps in current regulations, providing essential insights for anyone concerned about what’s on their plate.
Advertisement